NCST at Georgia Tech 2018 TRB Presentation Archive
Washington D.C. Jan 7 - 11, 2018
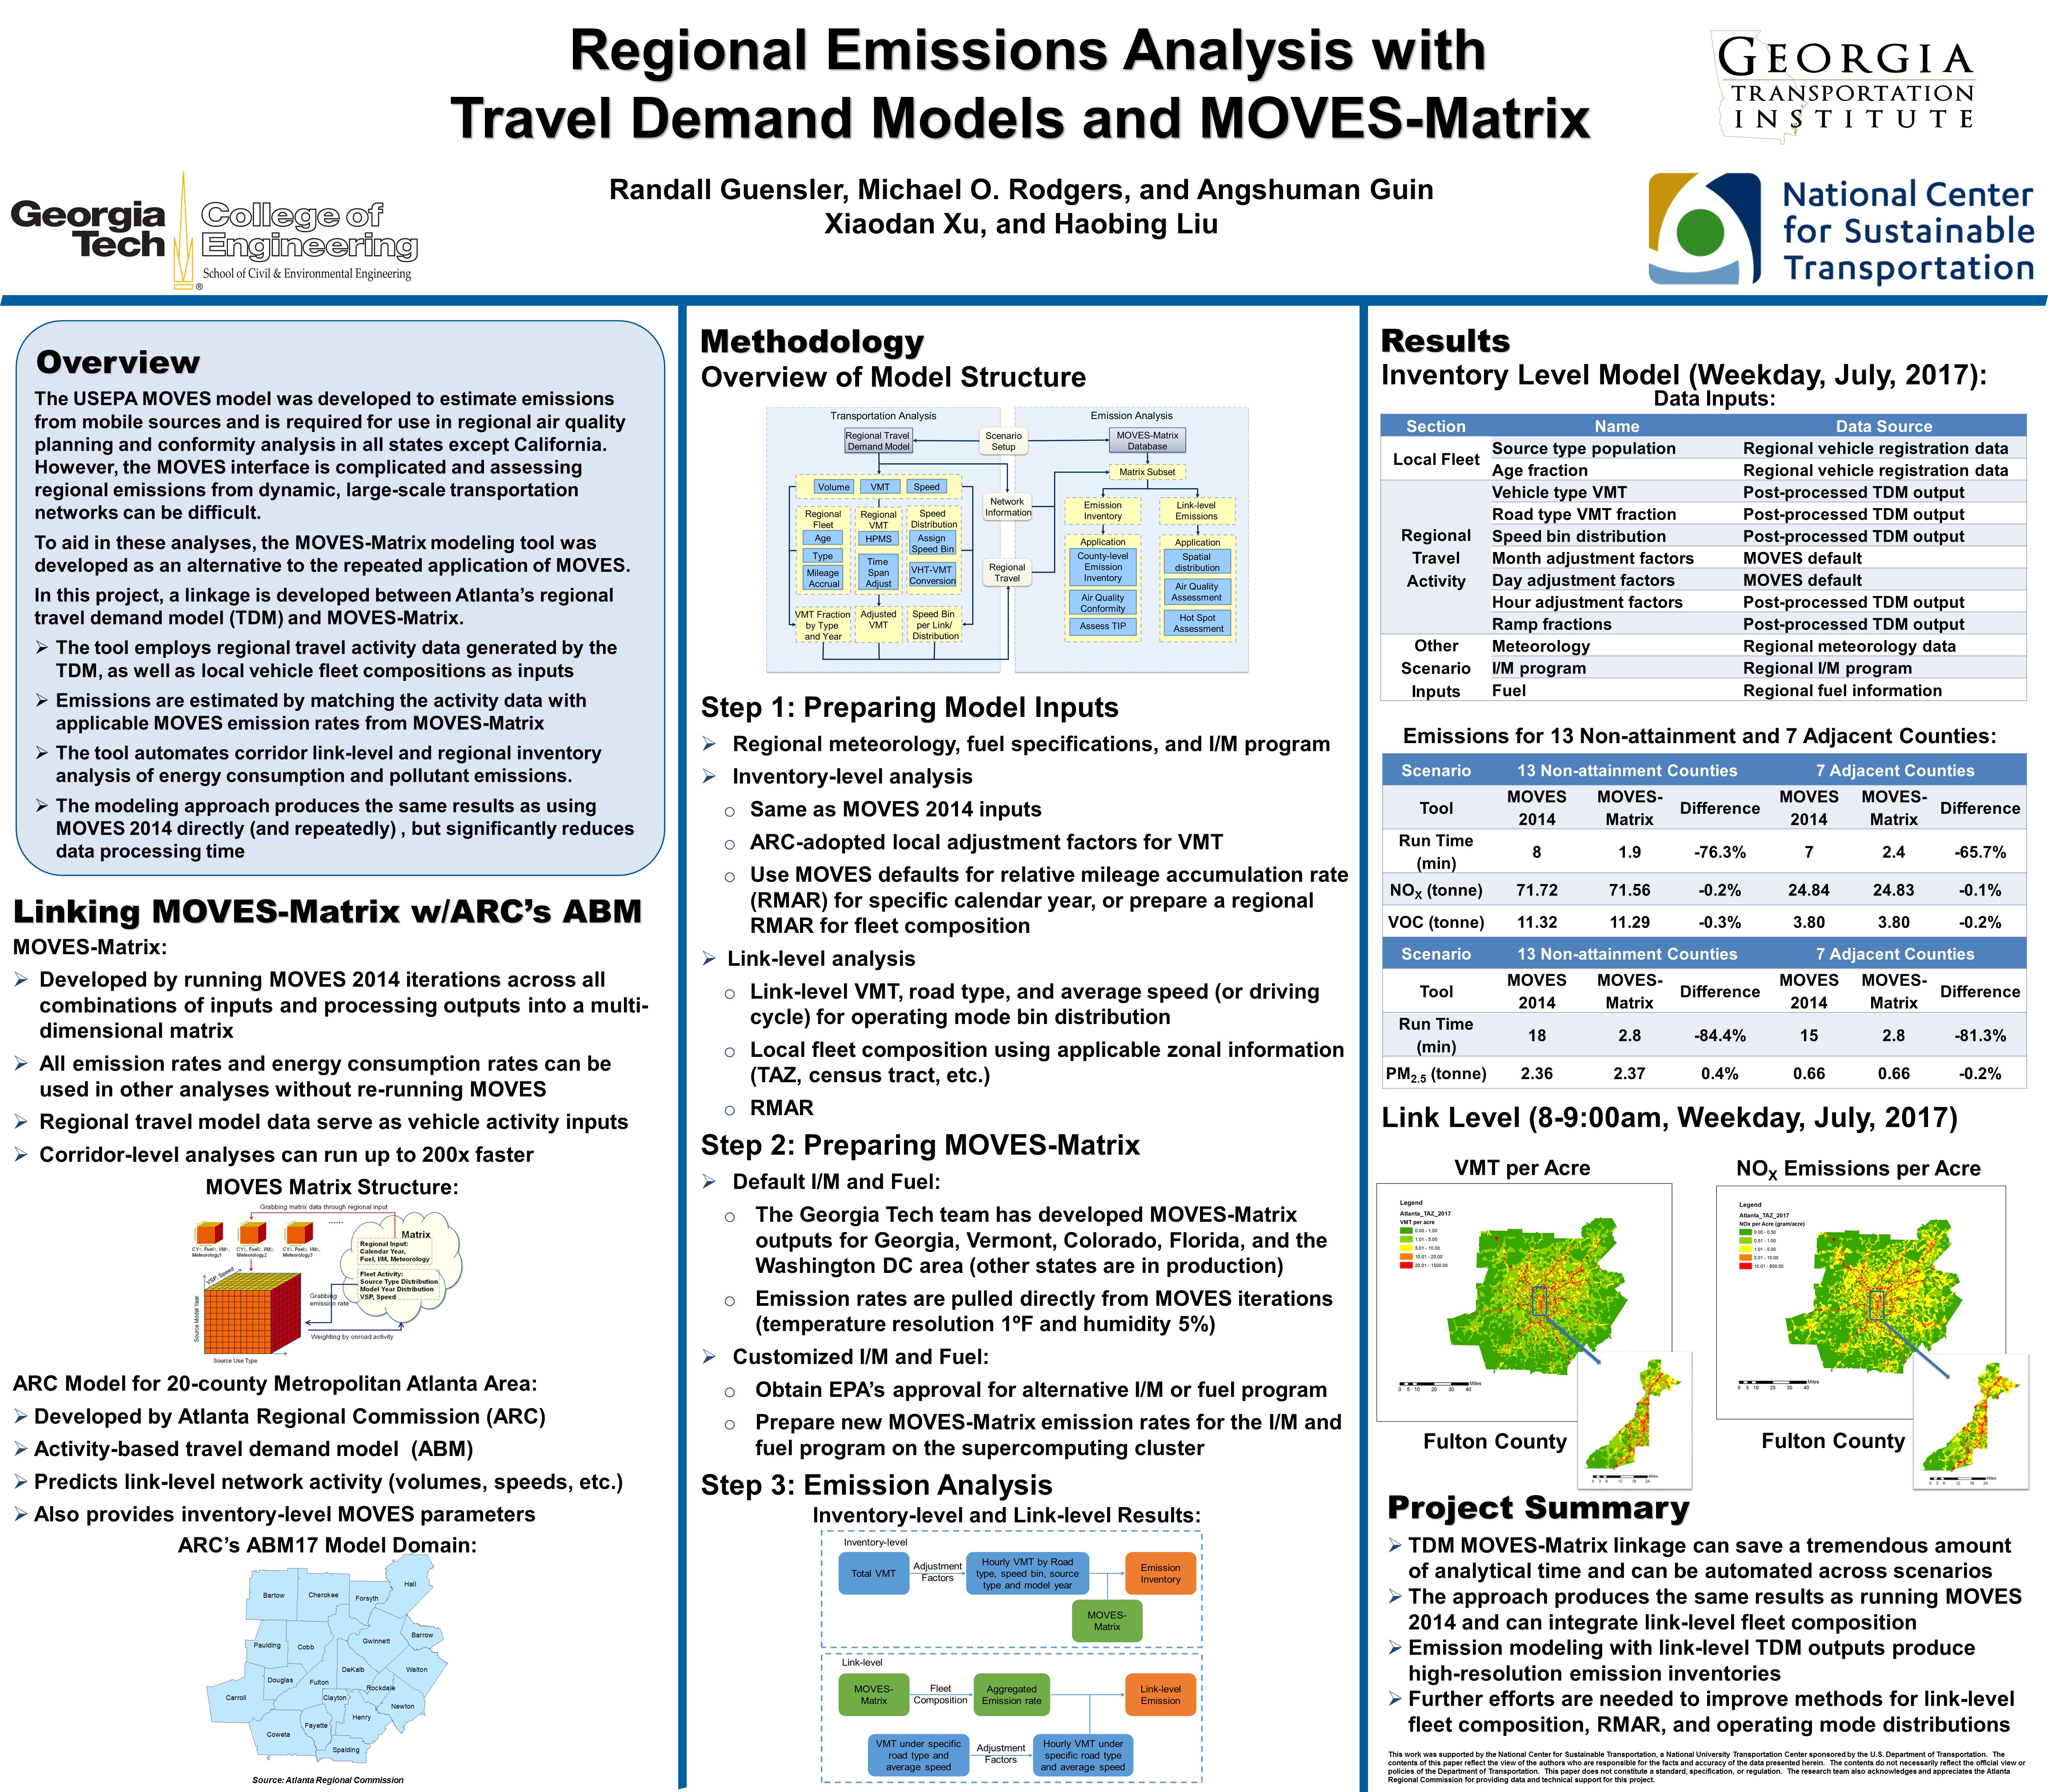
Regional Emission Analysis with Travel Demand Model and MOVES-Matrix (#18-05363)
Location: Convention Center, Hall E, B371
Time: 8:00 a.m. - 9:45 a.m., Tuesday, Jan 9, 2018
Presenter: Xiaodan Xu, Randall Guensler, Ph.D
Co-authors: Haobing Liu, Angshuman Guin Ph.D, Michael O. Rodgers Ph.D
View abstract Back to listAbstract: Travel demand models (TDM) are developed by Metropolitan Planning Organizations (MPOs) for analyzing regional travel patterns, and are often used to prepare activity inputs for use with the U.S. Environmental Protection Agency’s (EPA) MOtor Vehicle Emission Simulator (MOVES) for regional emissions inventory development, transportation air quality conformity analysis, and microscale air quality impact assessment. Modelers are required to either prepare multiple MOVES runs for various scenarios, or develop their own MOVES pre-processors and post-processors for emission modeling. Either approach is cumbersome and time-consuming. To reduce modeling time and resource requirements, the team has developed a tool that automates the processing of TDM outputs and produces the same results as MOVES. In this study, MOVES-Matrix emissions modeling processor was linked directly with TDM to develop emissions estimates at both the link and inventory levels. MOVES-Matrix was developed by iteratively running the MOVES across all possible combinations of input variables to create a multi-dimensional emission rate lookup matrix and produce much faster outputs at runtime. The Atlanta Regional Commission (ARC) TDM was used within metropolitan Atlanta area to demonstrate the performance of the automated tool. For this purpose, inventory-level emission modeling was first conducted using MOVES, and these emission results were compared with results from the automated process. Link-level emissions were similarly analyzed. The results indicate that the tool produces emission results identical to the direct application of MOVES, while significantly reducing processing time. The tool is beneficial for use in inventory development, conformity analysis, and microscale dispersion modeling.
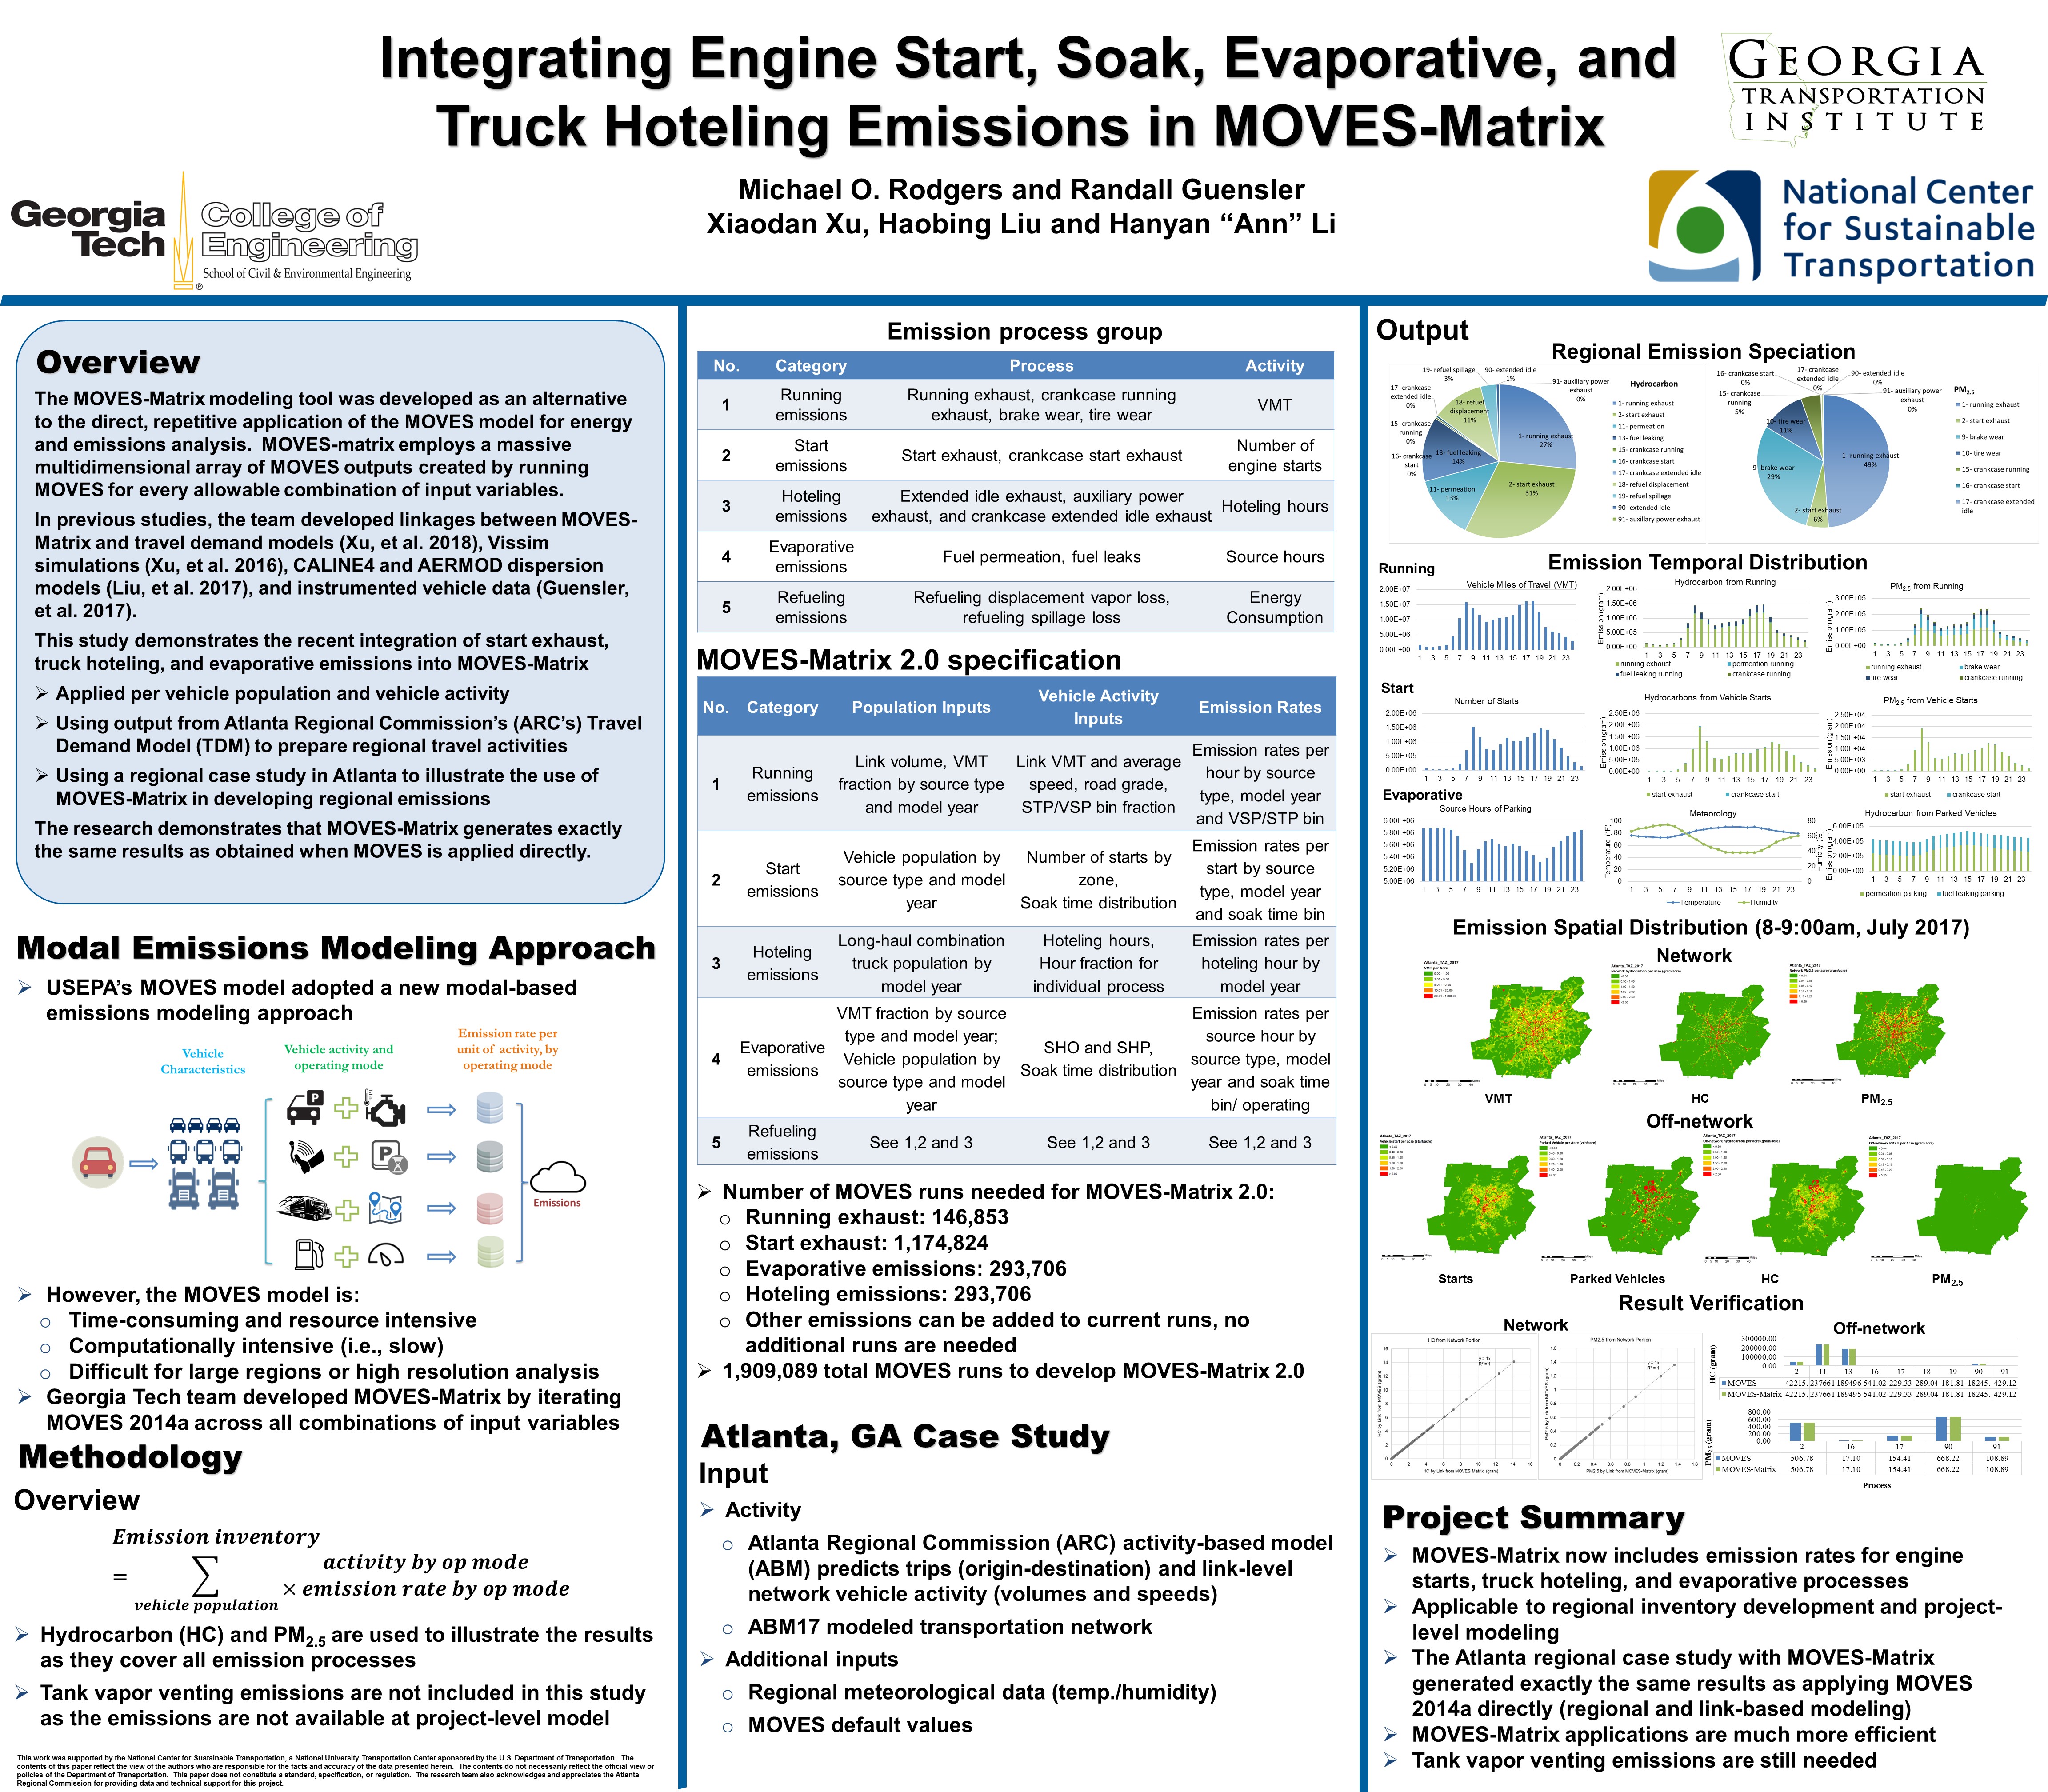
Integrating Engine Start, Soak, Evaporative, and Truck Hoteling Emissions into MOVES-Matrix (#18-04825)
Location: Convention Center, Hall E, B370
Time: 8:00 a.m. - 9:45 a.m., Tuesday, Jan 9, 2018
Presenters: Xiaodan Xu, Randall Guensler, Ph.D
Co-authors: Haobing Liu, Hanyan "Ann" Li, Michael O. Rodgers Ph.D
View abstract Back to listAbstract: The MOVES (MOtor Vehicle Emissions Simulator) model was developed by the US Environmental Protection Agency (USEPA) to estimate emissions from mobile sources and is required to be used for regional air quality planning and conformity analysis in all states except California. However, the MOVES interface is complicated and assessing emissions from dynamic large-scale transportation networks can be difficult. To aid in these analyses, the MOVES-Matrix modeling tool was developed as an alternative to the direct application of the MOVES model. MOVES-Matrix employs a massive multidimensional array of MOVES outputs created by running MOVES with every allowable combination of input variables. Once this output array has been generated, subsequent energy and emissions analyses can be conducted quickly and dynamically. Until recently, MOVES-Matrix has only been used to analyze running exhaust. In this study, MOVES-Matrix has been used expanded to include emissions from engine starts, truck hoteling, evaporative sources, brake/tire wear as well as running exhaust. A case study is conducted for the metropolitan Atlanta, GA to verify the feasibility of using this expanded version of MOVES-Matrix and to ensure that the approach obtains the exact same results as applying MOVES directly. The travel activity inputs come from regional travel data generated by the Atlanta Regional Commission’s Travel Demand Model. The emission results from MOVES-Matrix were compared to MOVES output to verify the equivalence of this approach.
Evaluation of Transit Ecodriving in Rural, Suburban, and Urban Environments (#18-05181)
Location: Convention Center, 143c
Time: 10:15 a.m. - 12:00 p.m., Wednesday, Jan 10, 2018
Presenters: Xiaodan Xu
Co-authors: Hanyan "Ann" Li, Haobing Liu, Michael O. Rodgers Ph.D, Randall Guensler, Ph.D.
View abstract Back to listAbstract: Ecodriving (also known as eco-driving) is a widely recognized strategy to reduce transit vehicle fuel consumption and emissions. Previous simulation modeling and field studies have demonstrated that ecodriving can reduce fuel consumption by 2% to 27%. However, prior studies have typically focused on urban transit operations. More than 1,700 transit agencies operate in rural areas within United States, operating under very different conditions than urban transit systems. Assessing the variability of fuel savings across various transit operating conditions and physical terrain conditions will help transit agencies predict the potential benefits of deploying ecodriving strategies for their systems. The objective of this study is to assess the potential benefits and limitations of deploying ecodriving strategies for different transit services, service areas, fleet composition, and road topographies. There are three preliminary tasks involved in this study. The first element collects and processes the operation data across different transit services. Second-by-second operation data are collected from one urban, suburban, and rural transit agency. The second element evaluates the operation characteristics of each type of transit services. The third element assesses the potential benefits of introducing the transit ecodriving strategy to the operations of these fleets. The fuel consumption is evaluated by matching the second-by-second MOVES model operating mode bin with corresponding emission rates. Overall, the ecodriving strategy can help reduce 1% to 5% fuel use across these agencies, and save $0.011 to $0.045 operational cost per mile due to the fuel saving. The actual benefits vary by service, mileage, and road grade impact.
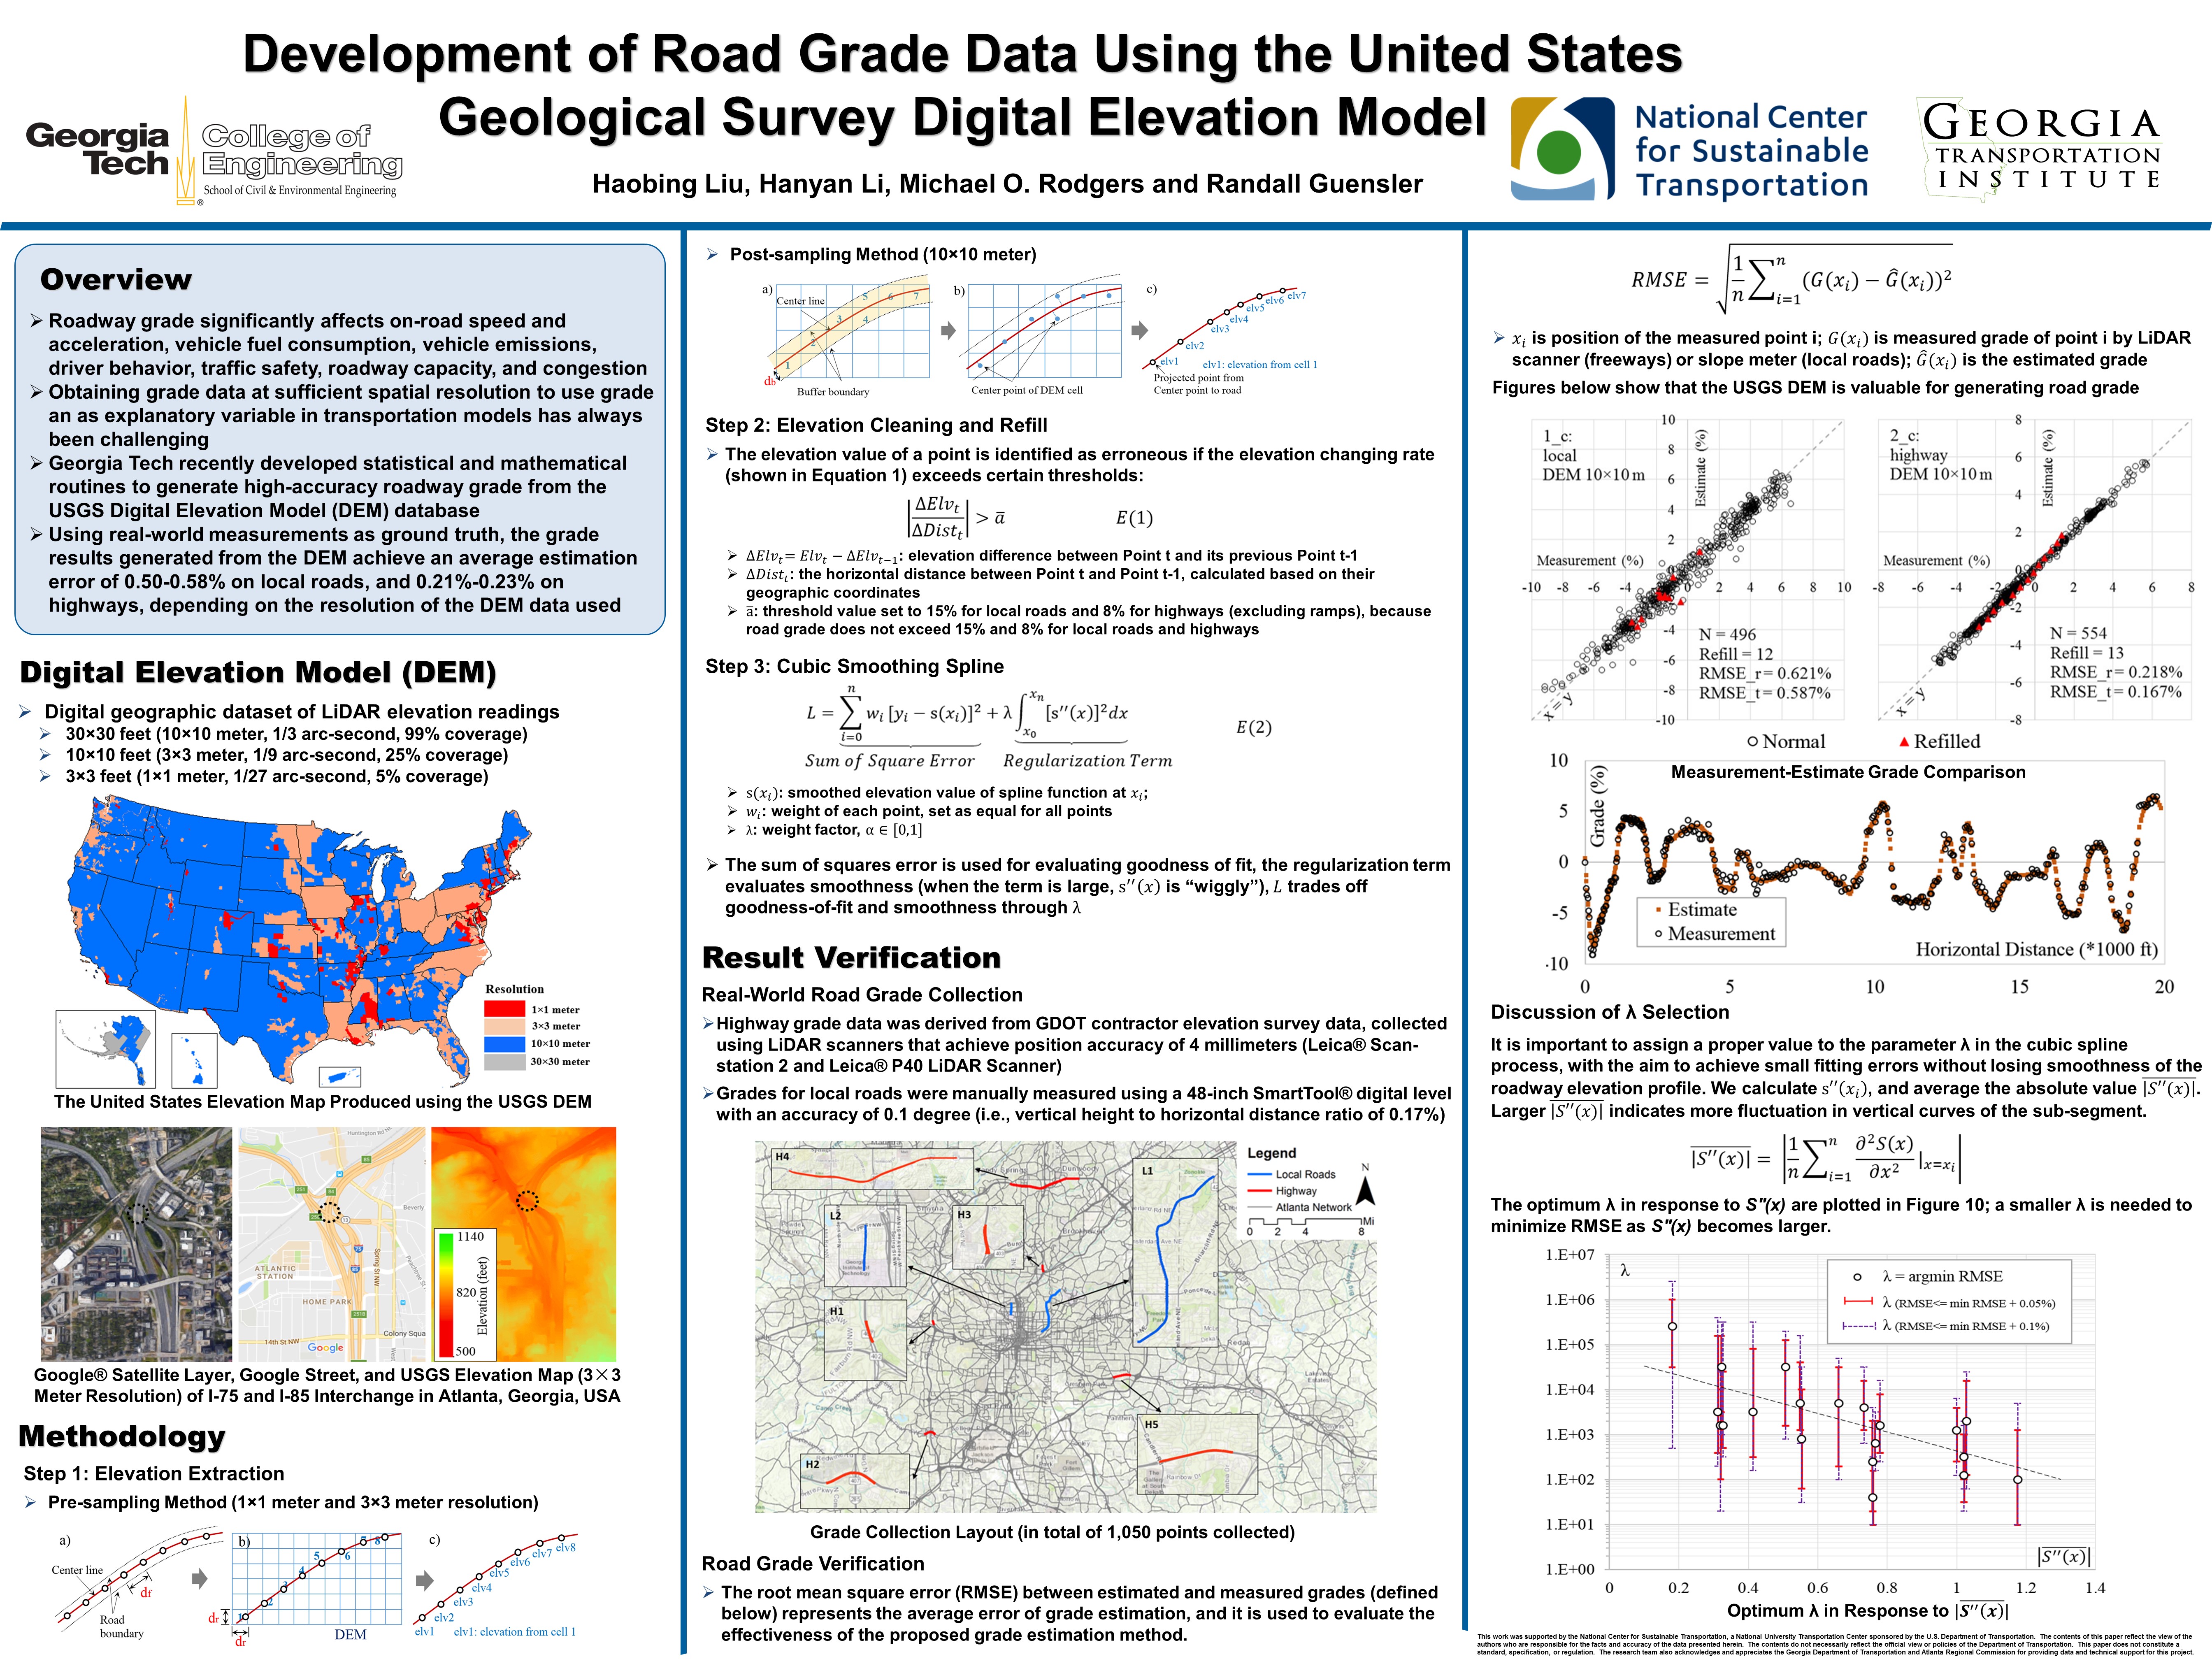
Development of Road Grade Data Using the United States Geological Survey Digital Elevation Model (#18-03535)
Location: Conventional Center, Hall E, A122
Time: 10:15 a.m. - 12:00 p.m., Monday, Jan 08, 2018
Presenters: Hanyan "Ann" Li, Randall Guensler Ph.D
Co-authors: Haobing Liu, Michael Rodgers Ph.D
View abstract Back to listAbstract: Roadway grade significantly affects onroad speed and acceleration, vehicle fuel consumption, vehicle emissions, driver behavior, traffic safety, roadway capacity, and congestion. However, it has always been challenging to obtain grade data at sufficient spatial resolution to use grade an as explanatory variable in transportation models. This paper aims to address this problem by proposing a method to obtain high-accuracy roadway grade data from the Digital Elevation Model (DEM), a nation-wide open data source from the U.S. Geological Survey (USGS). Although DEM data cover most of the nation, data resolution and the presence of roadway cut and fill sections affects spatial grade accuracy and requires a solid strategy to remove or refill these segments. Cubic smoothing spline is applied to minimize the impact of noisy data, and improve grade estimation accuracy. The selection of the key parameter λ in the spline method is also discussed to balance between smoothing out noisy elevation data, and retaining vertical fluctuations along the road. In general, λ is recommended 100 ~ 1,000 for local roads, and 1000~10,000 for highways to maintain small average estimation error. The relationship between optimum λ that minimizes Root Mean Square Error (RMSE) and road fluctuations is also explored, which can be used for λ selection. Using real-world measurements as ground truth, the grade results generated from the DEM achieve an average estimation error of 0.5-0.58% on local roads, and 0.21%-0.23% on highways, depending on the resolution of the DEM data used. The results demonstrated the validity and applicability of DEM in generating high-accuracy roadway grade data.
Assessing the Time, Monetary, and Energy Costs OF Alternative Modes (#18-05362)
Location: Conventional Center, Hall E, B363
Time: 10:15 a.m. - 12:00 p.m., Tuesday, Jan 09, 2018
Presenters: Hanyan "Ann" Li, Randall Guensler Ph.D
Co-authors: Yuanbo Wang, Xiaodan Xu, Haobing Liu, Angshuman Guin Ph.D, Michael Rodgers Ph.D, Michael Hunter Ph.D, Jorge Laval Ph.D, Khaled Abdelghany Ph.D
View abstract Back to listAbstract: One of the most popular strategies for reducing energy use and emissions in the transportation sector is to provide public transit systems designed to help shift commute mode choice from single-occupant vehicles to shared use transit vehicles. When transit ridership is high, energy use per commuter- trip is low. Promoting such mode shifts necessitates a clear understanding of the factors that influence mode choice, which is the basis for incorporation of choice modeling into travel demand models. However, the data used in transit choice modeling typically come from small studies, and it is difficult to accurately quantify the actual tradeoffs across different travel modes. This study develops a platform in Python to assess travel time, energy use, and monetary cost of various commute alternatives including automobile, local transit rail and bus, express bus, and park and ride. The platform consists of three modules: the routing module generates a best-available routing path per commute alternative; the energy module calculates energy use based on the MOVES-Matrix and the Fuel and Emissions Calculator, with real-world operations data applied; the cost module estimates the transit and driving cost. In the case study, 2,400 commute trips in Atlanta, Georgia are processed through the platform. The results show that transit availability can be significantly increased through park and ride without sacrificing fuel-saving benefits. However, travel time and cost are increased in most transit trips, and only two of the 2,400 local transit-park and ride trips yielded a reduction in all three parameters of travel time, energy use, and cost. This platform can be easily customized and applied to other areas.
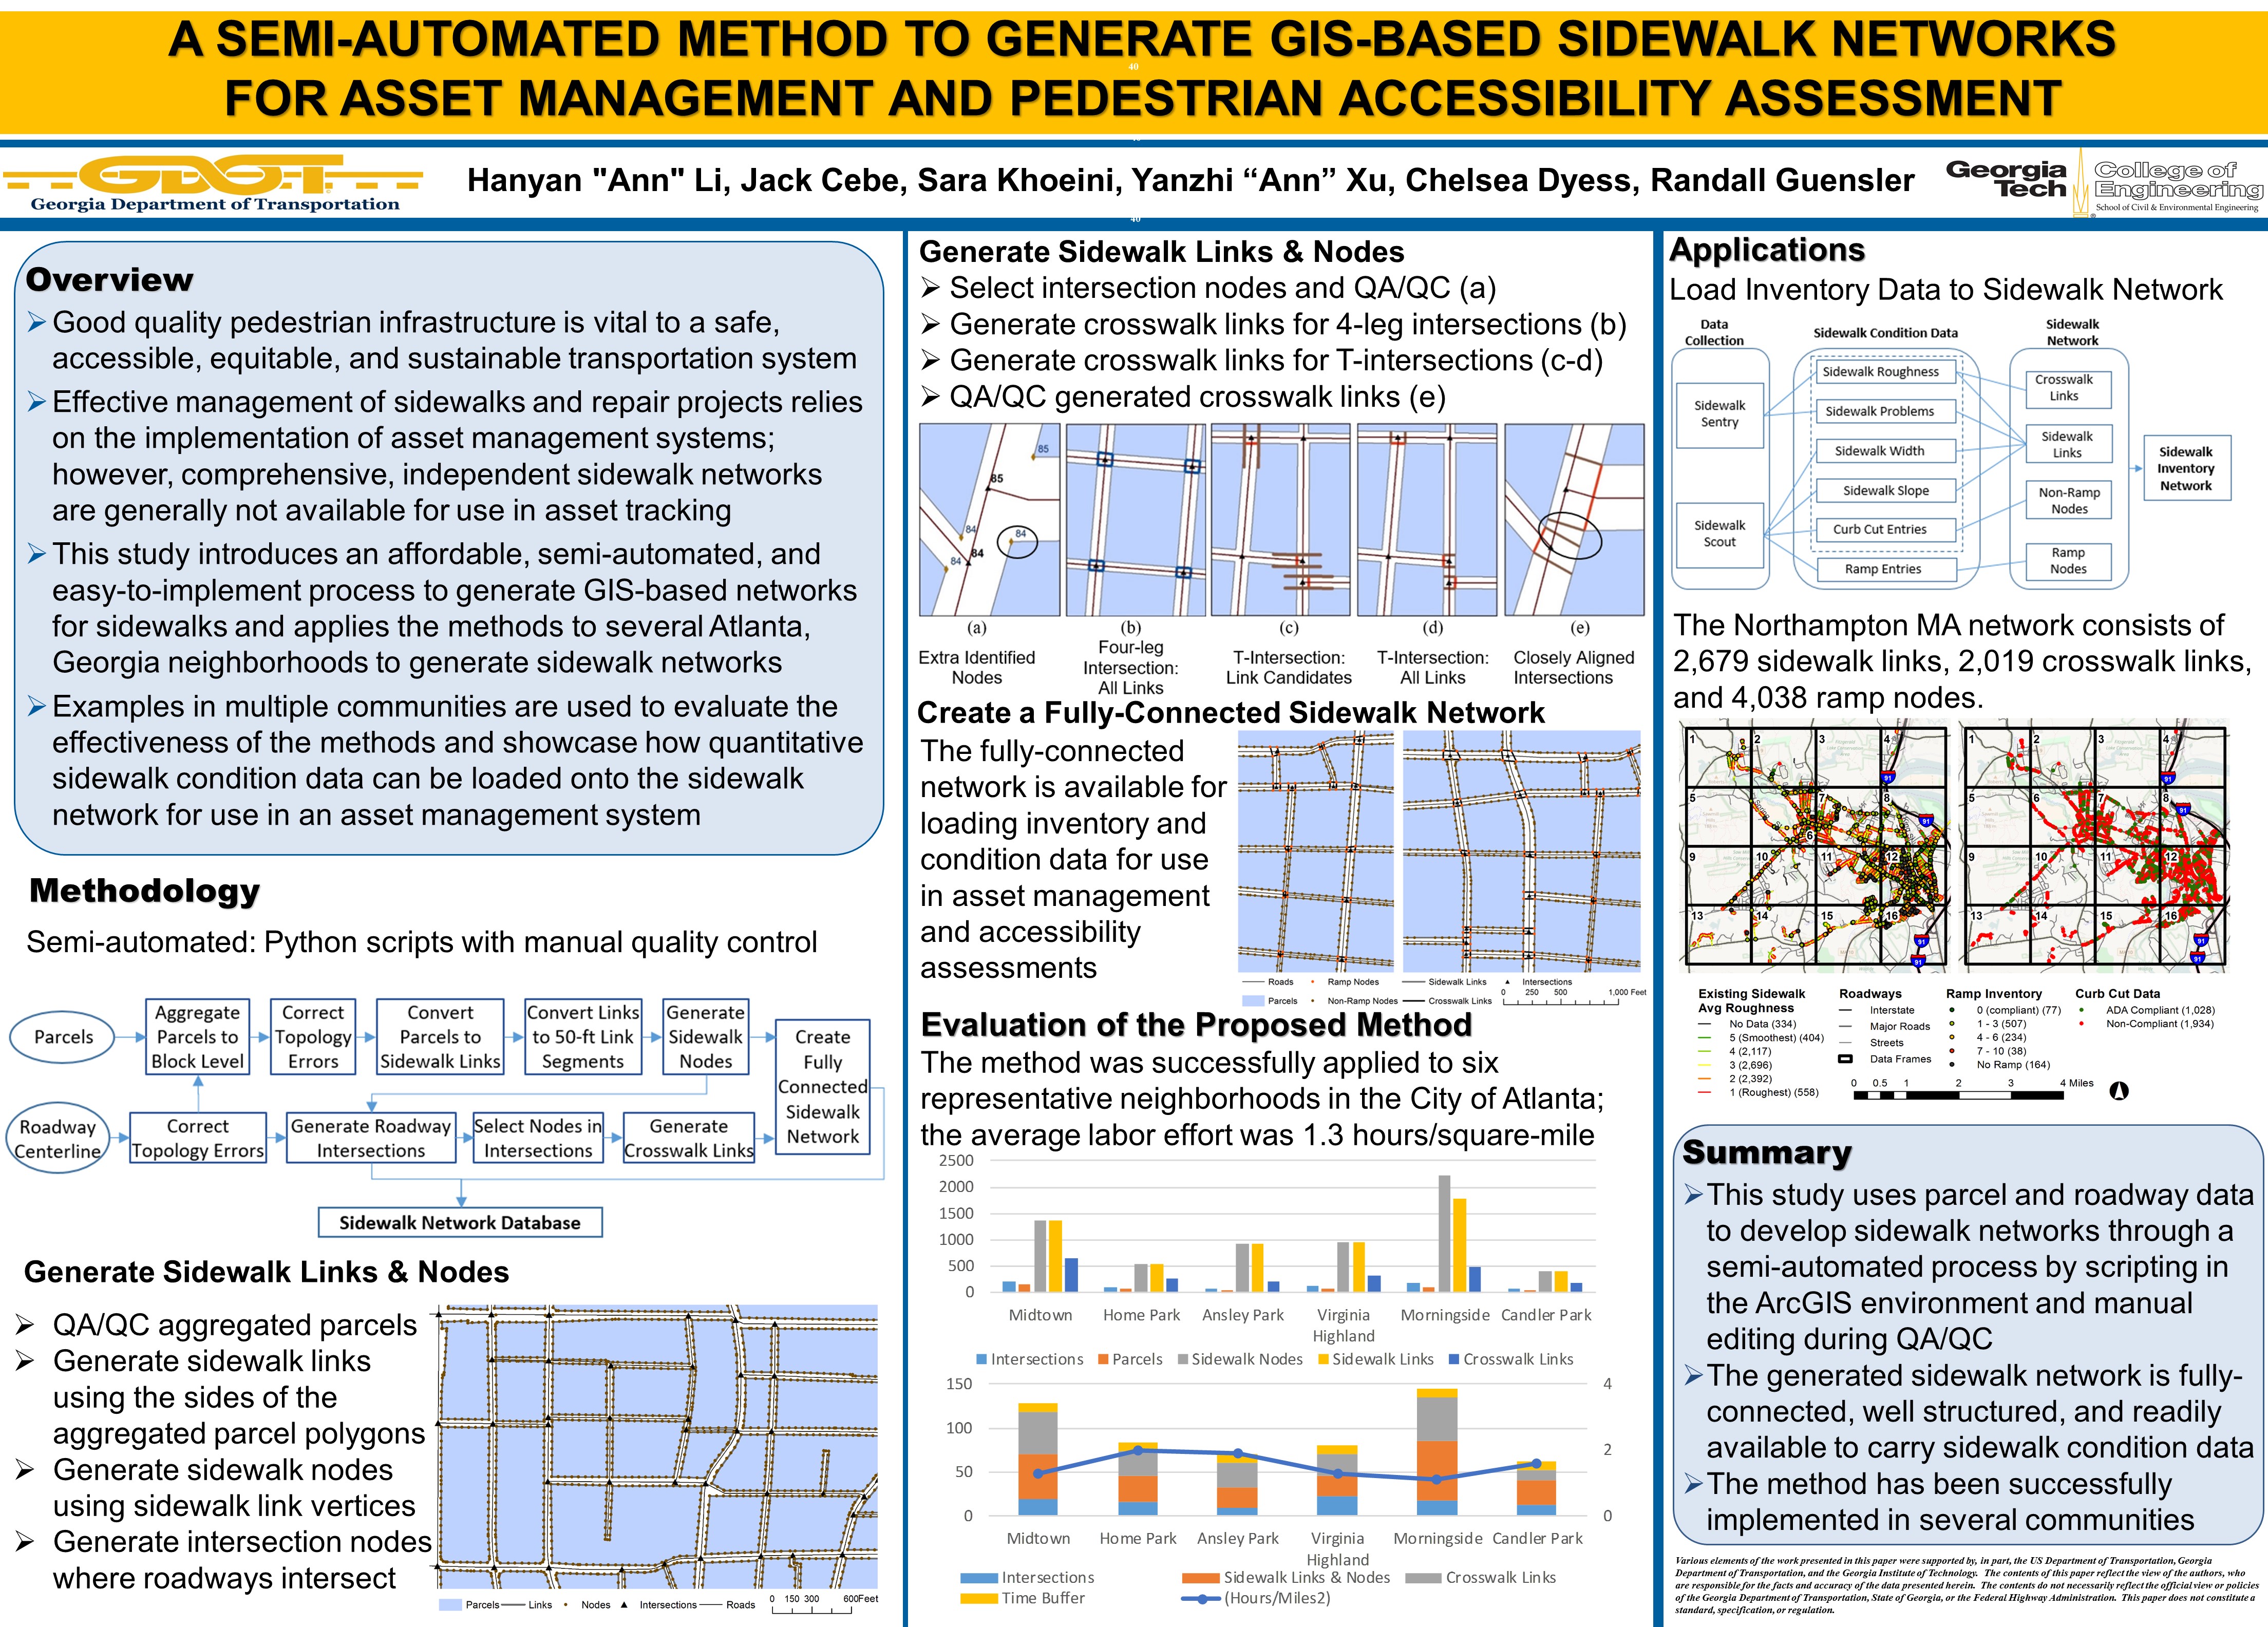
A Semi-Automated Method to Generate GIS-Based Sidewalk Networks For Asset Management And Pedestrian Accessibility Assessment (#18-02656)
Location: Conventional Center, Hall E, A260
Time: 08:00 a.m. - 09:45 a.m., Tuesday, Jan 09, 2018
Presenters: Hanyan "Ann" Li, Randall Guensler Ph.D
Co-authors: John Cebe, Sara Khoeini, Yanzhi "Ann" Xu Ph.D, Chelsea Dyess
View abstract Back to listAbstract: Pedestrian infrastructure that is comfortable, connected to destinations of interest, and accessible to those with disabilities is vital to a safe, accessible, equitable, and sustainable transportation system. Planners recognize the benefits of providing well-maintained sidewalks and curb ramps, but often lack the asset management systems necessary to inventory sidewalk maintenance problems, prioritize sidewalk maintenance needs, and track the implementation of sidewalk improvement projects. Communities that are managing sidewalk presence and condition data typically link the data to their roadway network, which makes tracking specific sidewalk assets difficult. This paper introduces an affordable, semi-automated, and easy-to-implement process to generate a GIS-based sidewalk network with associated links and nodes representing crosswalks and intersections. Quantitative sidewalk condition data can be loaded onto the network, which allows it to be used to managing sidewalks as transportation assets, assessing pedestrian accessibility, prioritize repairs or improvements, and automatically identify accessible routes between origins and destinations. System inputs include parcel-level land use and roadway centerline data, both of which are publicly available and free in most cases. The network is generated within the ArcGIS environment, using Python scripts to implement embedded ArcGIS functions. The method requires little in terms of computational resources, and tremendously reduces the manual labor required to develop a fully interconnected sidewalk network. Examples from multiple communities are presented to show how quantitative sidewalk condition data are loaded to the network, and illustrate the network’s potential in pedestrian navigation and routing applications.